Absolute Millivolt Potentials From Tetramethylrhodamine Methyl Ester (TMRM) and FLIPR fluorescence
The absolute calibrated ΔψM assay is based on fluorescence
microscopy of the cationic dye (TMRM; tetramethylrhodamine
methyl ester) together with an anionic, fluorescent plasma
membrane potential indicator (PMPI; a bis-oxonol; FLIPR plasma
membrane potential kit; Molecular Devices). Our technology
back-calculates ΔψP and ΔψM that drive changes in the time
courses of fluorescence intensities.
Commonly
used ΔψM assays often lead to data misinterpretation when plain
fluorescence is analyzed. This is because all of these probes
are influenced by multiple properties of cells other than ΔψM,
such as cell size, mitochondrial density, binding and plasma
membrane potential (ΔψP).
Fluorescence
intensity changes of redistribution-type potentiometric probes
reflect potentials distorted in time by their slow diffusion
across the plasma membrane. The calibration algorithm models and
cancels these effects. The algorithm takes cell size,
mitochondrial content, ΔψP, probe binding and auto- or
background fluorescence into account to calculate ΔψM.
The assay requires recording of fluorescence time courses to provide internal calibration. Calibration is
performed by using standardized paradigms of calibrant
additions. The software interprets fluorescence changes and
converts them to millivolts. See how it works in practice.
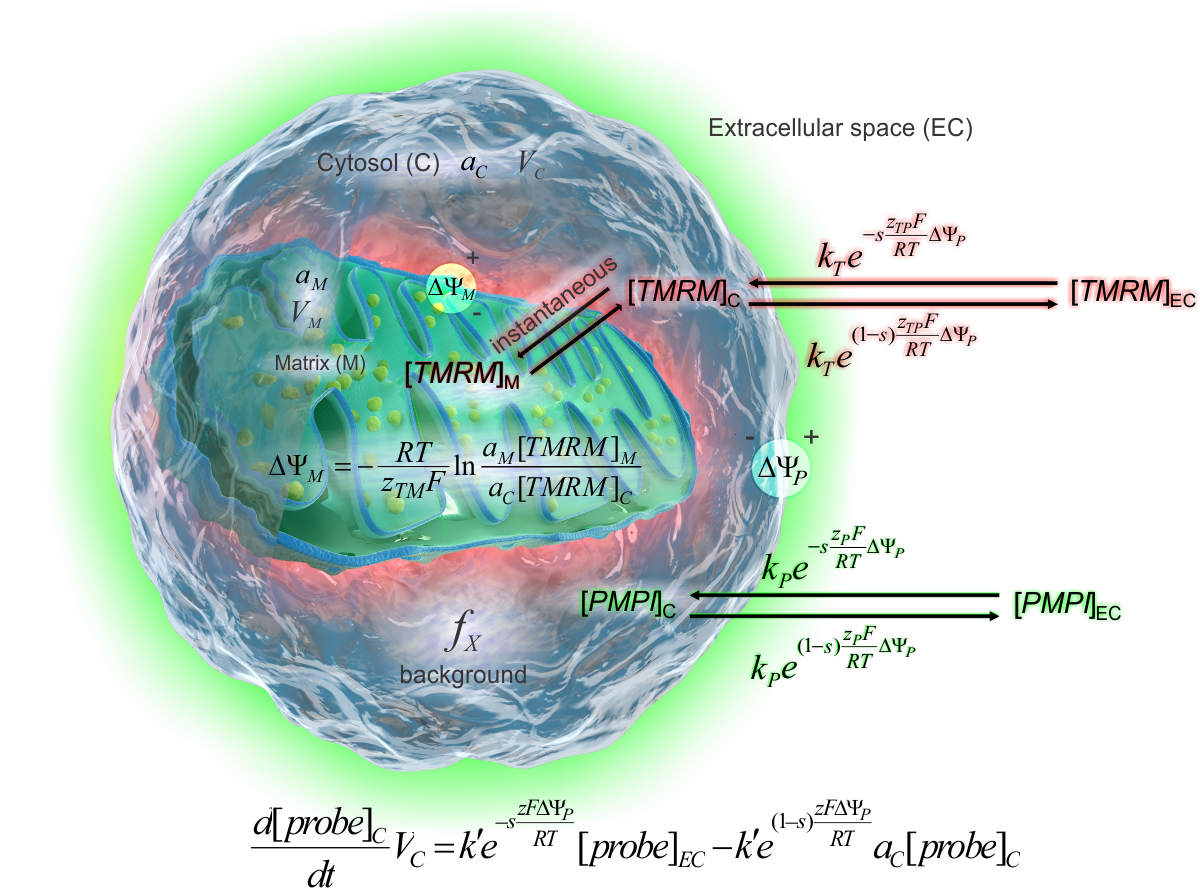
the biophysical model of the potentiometric calibration
The electrostatic barrier model of ion
transport through the plasma membrane (see scheme on the right)
accurately describes the behavior of the probes in cells. This model
provides the calibration rate equation (below the cell). The ΔψP is
calculated by solving this equation for ΔψP. ΔψM is calculated
by the Nernst equation where [TMRM]M and [TMRM]C
are expressed by the rate equation and the total fluorescence. See definition of terms in the
calibration equations here (17).
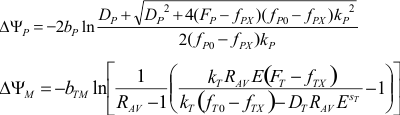
In practice, the calculation of absolute millivolt values of ΔψM and ΔψP is performed by finding all required parameters in the calibration equations. An internal calibration protocol provides all of this information. The Membrane Potential Calibration Wizard of Image Analyst MKII calculates all required parameters and applies the calibration equations to the fluorescence time courses.
The internal calibration encodes the
absolute values of ΔψP and ΔψM in the fluorescence intensity time
courses. Importantly, this enables not only absolute millivolt value
readout, but also unbiased comparison of different samples.
The calibration requires two axillary assays (measurement of mitochondria:cell volume fractions and the binding affinity/activity of TMRM to membranes). These assays rely on confocal microscopic recordings and image analysis in Image Analyst MKII. See protocols here. Alternatively, volume fractions may be known from literature. We found that the binding affinity of TMRM (expressed by aR') is within a narrow range between a variety of samples. Therefore in most application a 0.36 value can be used.
The Unbiased and Absolute Calibrated Mitochondrial Membrane Potential Assay
Image Analyst MKII is a one-of-a-kind solution for the measurement of the absolute magnitude of mitochondrial membrane potential (ΔψM) in intact cells.Image Analyst MKII provides the complete plasma and mitochondrial membrane potential measurement technique developed by Akos Gerencser and colleagues (17). This has been extended with additional variants of the calibration, using different calibration points and assumptions. For biologists with no biophysical or mathematical expertise, the intuitive Membrane Potential Calibration Wizard dialog provides easy and routine operation. This is supported by protocols for data acquisition, image processing pipelines for measurement of fluorescence intensities in image data from a variety of formats.
Why to look at ΔψM ?
ΔψM is a key bioenergetic parameter:
- the major component of the
proton motive force that determines the maximal available rate of ATP
formation in mitochondria
- knowledge of ΔψM helps to interpret
alterations in energy metabolism when matched with cell respirometry,
e.g. to identify uncoupling, or decreased activities of respiratory
complexes or ATP synthesis/transport
- high proton motive force is thought to be associated to
increased production of free radicals
Assaying ΔψM is relevant to research of:
- aging: efficiency of energy
production, reactive oxygen species formation
- cancer: Warburg effect, cell-to-cell heterogeneity
- metabolism:
uncoupling proteins, substrate oxidation pathways, substrate switching
- diabetes: ΔψM is a central component of the canonical pathway of insulin
secretion
ΔψM is a key bioenergetic parameter:
- the major component of the
proton motive force that determines the maximal available rate of ATP
formation in mitochondria
- knowledge of ΔψM helps to interpret
alterations in energy metabolism when matched with cell respirometry,
e.g. to identify uncoupling, or decreased activities of respiratory
complexes or ATP synthesis/transport
- high proton motive force is thought to be associated to increased production of free radicals
Assaying ΔψM is relevant to research of:
- aging: efficiency of energy production, reactive oxygen species formation
- cancer: Warburg effect, cell-to-cell heterogeneity
- metabolism: uncoupling proteins, substrate oxidation pathways, substrate switching
- diabetes: ΔψM is a central component of the canonical pathway of insulin secretion
Why most common fluorescence techniques fail to correctly measure
ΔψM ?
TMRM, TMRE non-quench mode (without using the Membrane
Potential Calibration Wizard):
- The readout is a
function of cell size, mitochondrial density, plasma membrane potential
(ΔψP), probe binding and time
- Most often changes in ΔψP are
misinterpreted as changes in ΔψM
- relative to baseline measurement
TMRM, TMRE, Rhodamine 123,
DiOC6(3) quench mode:
- Relies on the assumption of a constant quench
limit
- The readout is a function of mitochondrial density
- relative
to baseline measurement
- A common mistake in flow cytometer
applications is that quench mode probes report mitochondrial mass and
not potentials
- Toxicity
JC1 emission ratio
- The probe
accumulation is not an equilibrium process, therefore the readout is
dependent on ΔψP, time and surface to volume ratios.
- J-aggregates are
sensitive to oxidation
- The JC-1 emission ratio cannot be calibrated to millivolts
because of the above confounding factors, and comparison of different
samples can be easily misleading
TMRM, TMRE non-quench mode (without using the Membrane Potential Calibration Wizard):
- The readout is a function of cell size, mitochondrial density, plasma membrane potential (ΔψP), probe binding and time
- Most often changes in ΔψP are
misinterpreted as changes in ΔψM
- relative to baseline measurement
TMRM, TMRE, Rhodamine 123, DiOC6(3) quench mode:
- Relies on the assumption of a constant quench
limit
- The readout is a function of mitochondrial density
- relative
to baseline measurement
- A common mistake in flow cytometer
applications is that quench mode probes report mitochondrial mass and
not potentials
- Toxicity
JC1 emission ratio
- The probe
accumulation is not an equilibrium process, therefore the readout is
dependent on ΔψP, time and surface to volume ratios.
- J-aggregates are
sensitive to oxidation
- The JC-1 emission ratio cannot be calibrated to millivolts because of the above confounding factors, and comparison of different samples can be easily misleading
What questions can be addressed with an absolute ΔψM assay?
Determination of ΔψM in millivolts in single or populations of cells
Comparison of ΔψM in different samples (different cell types,
pre-treatments, genotypes or individuals)
Accurate comparison of relative changes between specimens with
different amounts of mitochondria
Measurement of changes of
ΔψM when ΔψP is also changing
Measurement of the heterogeneity of ΔψM
in cell populations
- E.g. in populations of type 2 diabetic and non-diabetic
beta-cells (26)
Modular kinetic analysis of oxidative phosphorylation
- E.g. in pancreatic β-cells (41)
ATP assay surrogate: ATP/ADP, phosphorylation potential are
thermodynamically linked to ΔψM.
- E.g. to asses glucose-response of pancreatic β-cells (26)
Determination of ΔψM in millivolts in single or populations of cells
Comparison of ΔψM in different samples (different cell types, pre-treatments, genotypes or individuals)
Accurate comparison of relative changes between specimens with different amounts of mitochondria
Measurement of changes of ΔψM when ΔψP is also changing
Measurement of the heterogeneity of ΔψM in cell populations
- E.g. in populations of type 2 diabetic and non-diabetic beta-cells (26)
Modular kinetic analysis of oxidative phosphorylation
- E.g. in pancreatic β-cells (41)
ATP assay surrogate: ATP/ADP, phosphorylation potential are thermodynamically linked to ΔψM.
- E.g. to asses glucose-response of pancreatic β-cells (26)
| Development of the unbiased, absolute mitochondrial membrane potential assay has been supported by: |
 |